Search the 39 sample products and try the stock, location, High Salvage, and HVS filters.
Adapted from the original HTML and CSS. All products, prices, dates, forecasts, and locations shown are fictional.
Behind the interface
From log to product cards
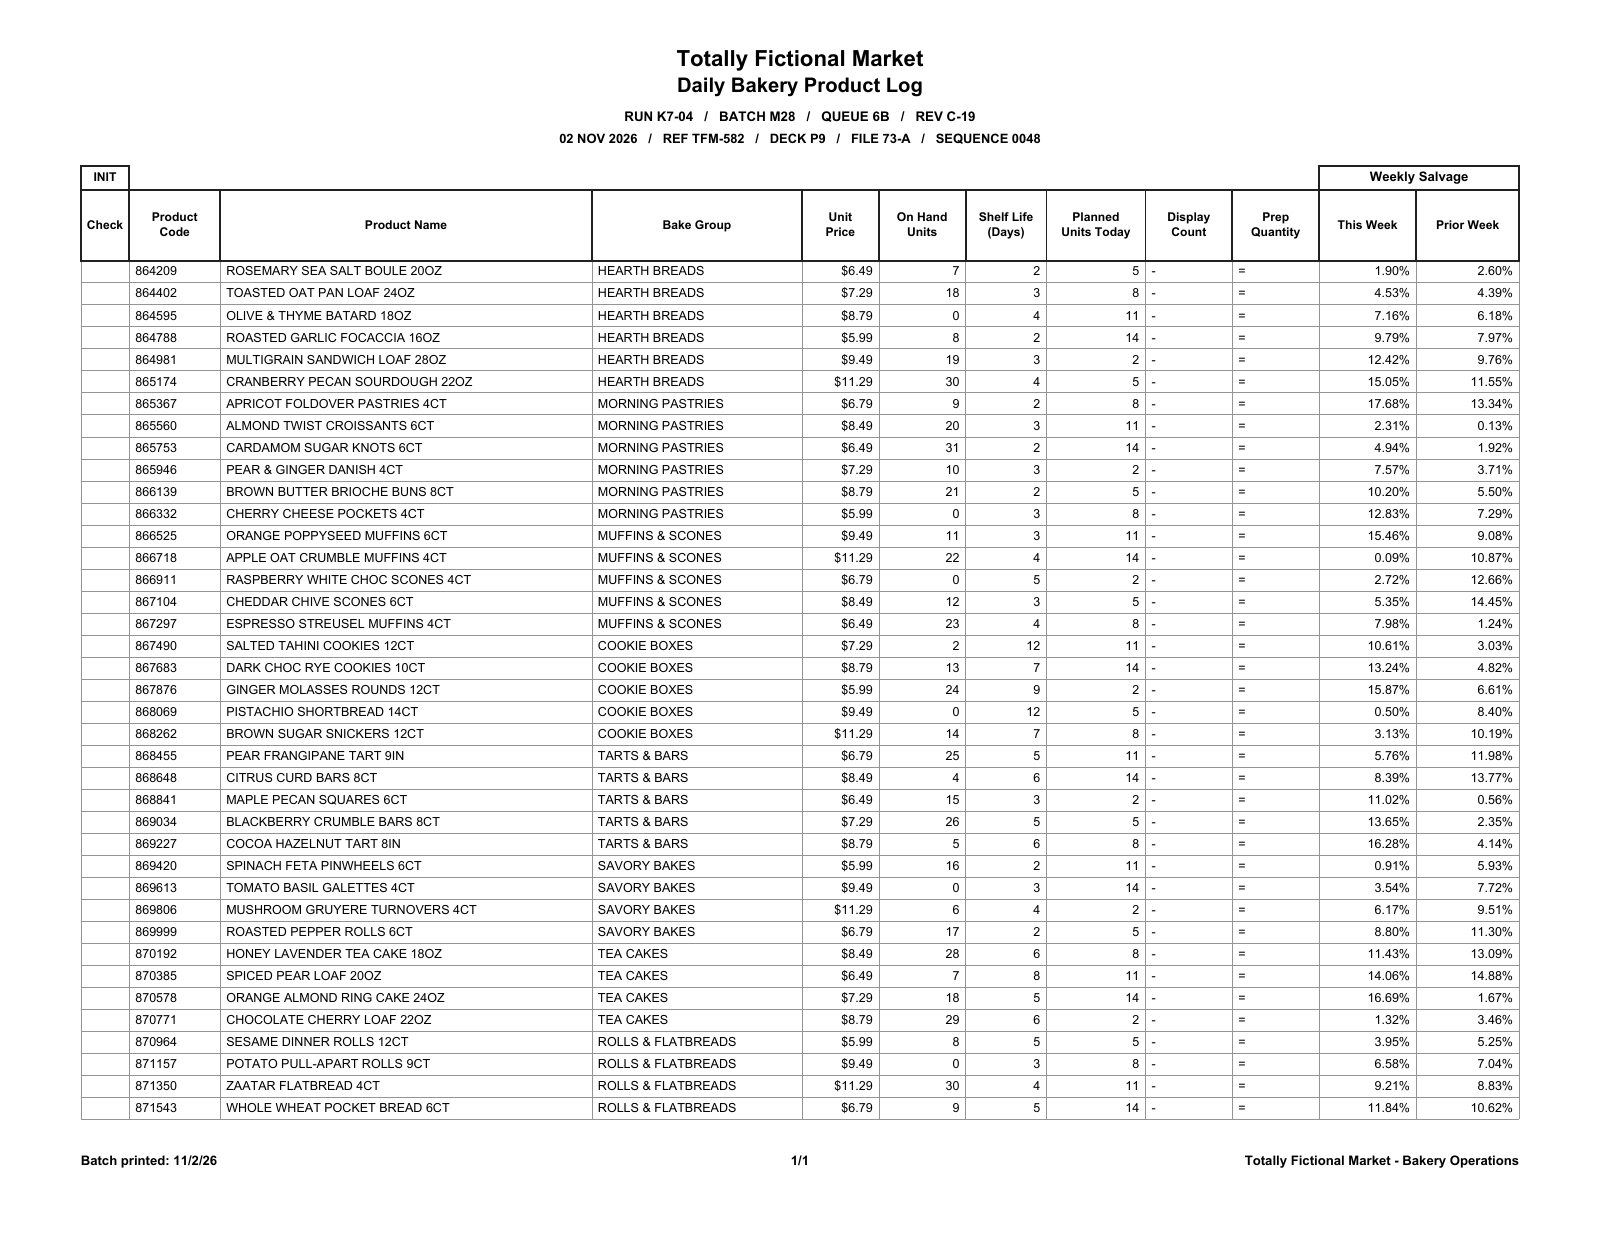
The original app started with a photo of a printed log. It extracted the text, organized the product information, and mapped categories to locations.
Fictional source document used for this demo. Open PDF ↗
01 / Capture
A clear photo of the printed sheet was the input to the original app.
02 / Organize
Amazon Textract extracted the text. The app brought prices, planned quantities, and shelf-life information together.
03 / Put it in context
Categories became familiar product locations. In this example, Hearth Breads maps to Bread wall, and Morning Pastries maps to Breakfast table.
The interactive demo above uses prepared data from this fictional PDF. It shows the resulting interface, without running image processing.
Example mapping and calculation rules
Hearth Breads and Rolls & Flatbreads → Bread wall Morning Pastries and Muffins & Scones → Breakfast table Cookie Boxes → Treats table Tarts & Bars and Tea Cakes → Dessert case Savory Bakes → Savory shelf
Breakfast table is marked HVS. Weekly salvage of 10% or more is marked High Salvage. Stock uses on-hand units; dates use November 2, 2026 plus shelf-life days. The final number on each card is planned units. Blank display counts mean a prep quantity cannot be calculated from this sample.
My contribution
I identified the workflow problem, built and tested the prototype, and refined it using feedback from coworkers. I wrote parts of the Python and used GPT assistance for functions and JavaScript development.
I also mapped unfamiliar product names to terms we used at work, making the information easier to recognize.
What happened in practice
I used the prototype during actual shifts, and several coworkers tried it and continued using it. Their feedback was positive, especially around making difficult logs easier to interpret.
The time savings were observed rather than formally measured. I eventually stopped running it because the operating cost was too high.
What I learned
A useful automation starts with understanding the task. Clear names and readable output mattered as much as extracting the data.
Testing also showed why input quality, accuracy checks, and ongoing API costs belong in the design from the beginning.
Why it matters for business analysis
This project connected a day-to-day operational problem with a technical solution: understand the workflow, clarify information, test with users, and revise based on what actually helps.
Portfolio preview only. This page does not upload images, call AWS, or use company records. The searchable cards use prepared data from a fictional bakery log.